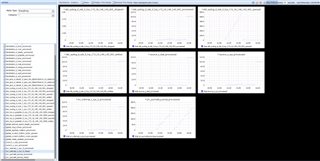
syslog-ng makes available various types of statistics. Data is available in a couple of forms: emitted regularly from the internal() source of syslog-ng or obtained using the syslog-ng-ctl utility from the command line. Due to the format that the internal source or the “stats” option of syslog-ng-ctl uses, it is not easy to send statistical data to Graphite or anywhere else. The syslog-ng-ctl utility provides a flexible “query” option, (available in recent versions of syslog-ng) which uses an easy-to-parse output format. Using the “jo” utility by @JPMens, you can convert the output to JSON, which can then be parsed by syslog-ng and forwarded to Graphite.
Before you begin
In order to use the “query” option of syslog-ng-ctl, you need a recent enough version of syslog-ng. The query option appeared in syslog-ng version 3.10.1. If your distribution of choice provides an older version, check https://www.syslog-ng.com/products/open-source-log-management/3rd-party-binaries.aspx to see if there are any up-to-date packages from unofficial repositories.
The “jo” utility can create JSON output from a shell. Unfortunately, it is not yet available in most distributions. Luckily, however, it is really easy to compile. Source code together with documentation are available on GitHub: https://github.com/jpmens/jo
You also need Graphite installed. It’s easiest to install Graphite in Docker as I described in one of my earlier blogs.
Figuring out what to collect
Using the query option of syslog-ng-ctl, you can fine-tune what information to collect. Issue the following command to list available fields:
[root@localhost ~]# syslog-ng-ctl query list
dst.java.d_elastic#0.java_dst,ElasticSearch_v2,syslog-ng,syslog-ng.dropped
destination.d_cron.processed
[…]
dst.syslog.d_ssb#0.tcp,172.16.146.142:601.written
source.s_sys.processed
[root@localhost ~]#
If you want to apply wildcards in your query, then use the “get” option. To receive all values, use ‘*’. For a subset of values, use part of the name as a prefix. For example:
[root@localhost ~]# syslog-ng-ctl query get 'center.*'
center.received.processed=980
center.queued.processed=12969
[root@localhost ~]#
You can read in depth about the different fields available in log statistics in the syslog-ng documentation at https://www.syslog-ng.com/technical-documents/doc/syslog-ng-open-source-edition/3.16/administration-guide
Configuring syslog-ng
Originally, I tried the logger utility to get JSON data into syslog-ng but it failed for larger messages (more fields included). So I recommend using netcat for sending statistical data over a network port to syslog-ng.
In the following configuration example:
- We use port 514 to receive logs.
- We set the “no-parse” flag as by default, syslog-ng parses everything as syslog, but in this case we collect pure JSON messages.
- The JSON parser adds the “stat.” prefix to the name-value pairs found.
- A JSON file destination is defined for easy debugging. You can delete / comment it out once you have everything working with Graphite.
- You also need to change the IP address in the Graphite destination to reflect your local environment.
- Finally, the log path connects all of these components together.
source s_stat {
    tcp(ip(127.0.0.1) port(514) flags(no-parse));
};

parser p_json {
    json-parser (prefix("stat."));
};

destination d_json {
    file("/var/log/test.json"
        template("$(format-json --scope nv-pairs)\n"));
};

destination d_graphite {
  tcp( "172.16.146.133"
    port(2003)
    template("$(graphite-output --key stat.* )")
  );
};

log {
    source(s_stat);
    parser(p_json);
    destination(d_json);
    destination(d_graphite);
};
Collecting statistics
In order to have a periodic update of syslog-ng statistics in Graphite, you need to run syslog-ng-ctl regularly. Doing this by hand in the long term is boring so I recommend using cron to run syslog-ng-ctl and related commands. Before adding the commands to the scheduler, you should test the commands from a shell as root.
syslog-ng-ctl query get '*' | sed -e 's/[\.|\#|\,|\:]/_/g' | jo | nc 127.0.0.1 514
This command line gets all available statistical values from syslog-ng.
Here’s what we do:
- In order to have a flat and valid name space, we replace all special characters here with underscores using sed. You can fine-tune field names for your environment by changing the search expression.
- We pipe the results to jo to format it to JSON.
- Finally, we use netcat to send the results to syslog-ng to port 514 on the local host.
- Check /var/log/test.json and/or Graphite to see if logs arrive as expected:
[root@localhost conf.d]# tail -1 /var/log/test.json
{"stat":{"src_journald_journal_stamp":"1508934721","src_journald_journal_processed":"214","src_internal_s_sys_0_stamp":"1508934721","src_internal_s_sys_0_processed":"10115","source_s_sys_processed":"10115","source_s_stat_processed":"9842","global_sdata_updates_processed":"0","global_scratch_buffers_count_queued":"2147483647","global_scratch_buffers_bytes_queued":"0","global_payload_reallocs_processed":"10324","global_msg_clones_processed":"0","global_internal_queue_length_processed":"0","dst_tcp_d_graphite_0_tcp_172_16_146_133_2003_written":"44","dst_tcp_d_graphite_0_tcp_172_16_146_133_2003_queued":"0","dst_tcp_d_graphite_0_tcp_172_16_146_133_2003_processed":"44","dst_tcp_d_graphite_0_tcp_172_16_146_133_2003_dropped":"0","dst_syslog_d_ssb_1_tcp_172_16_146_143_601_written":"0","dst_syslog_d_ssb_1_tcp_172_16_146_143_601_queued":"1000","dst_syslog_d_ssb_1_tcp_172_16_146_143_601_processed":"10329","dst_syslog_d_ssb_1_tcp_172_16_146_143_601_dropped":"9329","dst_syslog_d_ssb_0_tcp_172_16_146_142_601_written":"10328","dst_syslog_d_ssb_0_tcp_172_16_146_142_601_queued":"1","dst_syslog_d_ssb_0_tcp_172_16_146_142_601_processed":"10329","dst_syslog_d_ssb_0_tcp_172_16_146_142_601_dropped":"0","destination_d_ssb_processed":"20658","destination_d_spol_processed":"0","destination_d_mlal_processed":"0","destination_d_mesg_processed":"10275","destination_d_mail_processed":"0","destination_d_kern_processed":"0","destination_d_json_processed":"44","destination_d_graphite_processed":"44","destination_d_cron_processed":"53","destination_d_boot_processed":"0","destination_d_auth_processed":"1","center_received_processed":"19957","center_queued_processed":"31075"},"SOURCE":"s_stat","MESSAGE":"{\"destination_d_cron_processed\":53,\"global_sdata_updates_processed\":0,\"source_s_stat_processed\":9842,\"global_scratch_buffers_count_queued\":193273528320,\"dst_tcp_d_graphite_0_tcp_172_16_146_133_2003_dropped\":0,\"destination_d_json_processed\":44,\"destination_d_mail_processed\":0,\"destination_d_auth_processed\":1,\"global_scratch_buffers_bytes_queued\":0,\"destination_d_graphite_processed\":44,\"center_received_processed\":19957,\"destination_d_kern_processed\":0,\"dst_syslog_d_ssb_1_tcp_172_16_146_143_601_queued\":1000,\"dst_syslog_d_ssb_1_tcp_172_16_146_143_601_dropped\":9329,\"src_internal_s_sys_0_stamp\":1508934721,\"src_internal_s_sys_0_processed\":10115,\"dst_syslog_d_ssb_0_tcp_172_16_146_142_601_dropped\":0,\"destination_d_ssb_processed\":20658,\"dst_tcp_d_graphite_0_tcp_172_16_146_133_2003_processed\":44,\"src_journald_journal_stamp\":1508934721,\"dst_syslog_d_ssb_0_tcp_172_16_146_142_601_queued\":1,\"dst_tcp_d_graphite_0_tcp_172_16_146_133_2003_written\":44,\"destination_d_spol_processed\":0,\"global_msg_clones_processed\":0,\"center_queued_processed\":31075,\"dst_tcp_d_graphite_0_tcp_172_16_146_133_2003_queued\":0,\"src_journald_journal_processed\":214,\"destination_d_mlal_processed\":0,\"destination_d_mesg_processed\":10275,\"global_payload_reallocs_processed\":10324,\"dst_syslog_d_ssb_0_tcp_172_16_146_142_601_processed\":10329,\"destination_d_boot_processed\":0,\"dst_syslog_d_ssb_1_tcp_172_16_146_143_601_written\":0,\"dst_syslog_d_ssb_1_tcp_172_16_146_143_601_processed\":10329,\"global_internal_queue_length_processed\":0,\"dst_syslog_d_ssb_0_tcp_172_16_146_142_601_written\":10328,\"source_s_sys_processed\":10115}","HOST_FROM":"127.0.0.1","HOST":"127.0.0.1"}
- Once your configuration works, add the above command to cron. Open an editor:
crontab -e
The first five columns in the file define scheduling. If you want to collect statistics every minute, use the following line. Otherwise, check the crontab manual page. Depending on your cron configuration, you might need to add the full path to the applications. In my case:
* * * * * /usr/sbin/syslog-ng-ctl query get '*' | sed -e 's/[\.|\#|\,|\:]/_/g' | /usr/local/bin/jo | nc 127.0.0.1 514
- Save your cron configuration. Within a minute, you should see a new log message in /var/log/test.json and/or Graphite.

Other possibilities
Using the Graphite destination is just one of several possibilities. You can also send the statistics data to Elasticsearch and query it using Kibana, or send it to the Riemann destination for monitoring.


