

Elasticsearch is gaining momentum as the ultimate destination for log messages. There are two major reasons for this:
-
You can store arbitrary name-value pairs coming from structured logging or message parsing.
-
You can use Kibana as a search and visualization interface.
Logging to Elasticsearch:the traditional way
Originally, you could only send logs to Elasticsearch via Logstash. However the problem with Logstash is that since it requires Java to run, it is quite heavy-weight, and most of it was written in Ruby. While the use of Ruby makes it easy to extend Logstash with new features, it is too resource-intensive to be used universally, and definitely not something to be installed on thousands of servers, virtual machines or containers. The workaround for this problem is using the different Beats data shippers, which are friendlier with resources.
If you also need reliability and scalability, you also need buffering. For this purpose, you need an intermediate database or message broker: Beats and Logstash support Redis and Apache Kafka.
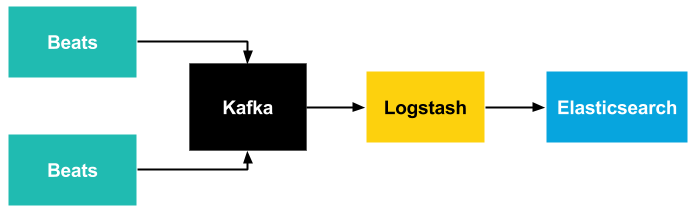
If you look at the architecture above, you’ll see that you need to learn many different softwares to build an efficient, reliable and scalable logging system around Elasticsearch. Each of these serve a different purpose, and have different requirements and configuration.
Logging to Elasticsearch made simple
The good news is that syslog-ng can fulfill all of the roles mentioned before. Most of syslog-ng is written in efficient C code, so it can be installed without extra resource overhead even in containers. It uses PatternDB to parse free-form log messages, which uses an efficient Radix-tree based algorithm instead of resource-hungry regular expressions. Naturally, regular expressions and a growing number of other parsers are also available, implemented in efficient C code. In addition, you can easily implement your own parsers in Python, with merely a slight loss of performance. The original version of the Elasticsearch destination driver was based on Java. While it is still available (at least for a while), the new elasticsearch-http() destination is written in C and is a lot more efficient than the Java-based destination in most situations.
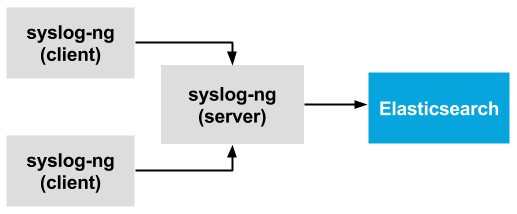
As syslog-ng has disk-based buffering, you do not need external buffering solutions to enhance scalability and reliability, which makes your logging infrastructure easier to create and maintain. Disk-based buffering has been available in syslog-ng Premium Edition (the commercial version of syslog-ng) for a long time, and recently also became part of syslog-ng Open Source Edition (OSE) 3.8.1.
Using a single application for all your logging needs has another benefit: it is much easier to work with Operations and Security at your company. Collecting system logs with one application locally, forwarding the logs with another one, collecting audit logs with a different app, buffering logs with a dedicated server, and processing logs with yet another app centrally means installing five different applications on your infrastructure. All of these can be implemented using syslog-ng. A single app to learn and to follow in bug & CVE trackers. A single app to push through the security and operations teams, instead of five.
How to get started with syslog-ng and Elasticsearch
The syslog-ng application comes with detailed documentation to get you started and help you fine-tune your installation.
-
To give syslog-ng a try, download syslog-ng OSE or ask for a trial PE
-
How to parse data with syslog-ng, store in Elasticsearch and analyze with Kibana
If you want to get started with parsing messages (replacing Grok), see the following links:
Are you stuck?
If you have any questions or comments related to syslog-ng, do not hesitate to contact us. You can reach us by e-mail or even in real time via chat. For a long list of possibilities, check our contact page at https://www.syslog-ng.com/contact-sales/.
