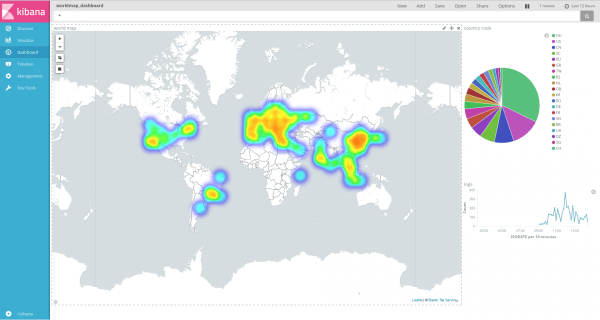
Last week after publishing my Elasticsearch 5 blog, I finally had a little time to take a look at the logs coming from my Turris Omnia router. It is running in a quiet neighborhood of Budapest, but looking at my logs it shows that I’m living in a busy part of the Internet. After checking a few IP addresses from rejected incoming connections, I decided to display them on a map instead of checking them one by one. Here’s the visualization for a few hours’ worth of logs:

Read on if you want to learn how to visualize your log data using such a heat map.
Log source
My log source was iptables running on my ARM Linux router. It is logging all incoming connections. Normally, there shouldn’t be anybody trying to connect to my router, but in practice it happens all the time, even from countries I have never heard of before. They are mostly trying to connect to telnet, ssh, http/https ports, sometimes some other protocols. If you don’t have iptables, other firewalls might also provide you with useful logs. To be able to use my configuration or to adopt it, the firewall needs to log using key=value pairs.
As my router is too small to run Elasticsearch, all of the logs are forwarded from the device over a TCP syslog connection to a virtual machine running the ESK stack (Elasticsearch + syslog-ng + Kibana).
Software
My test environment included syslog-ng 3.8.1 and Elasticsearch / Kibana 5.0 running on RHEL 7.3. This setup is described in detail in my syslog-ng and Elasticsearch 5 getting started guide. Further practical details about how to get started storing logs in Elasticsearch using syslog-ng are available in our Elasticsearch white paper.
Version 3.7 of syslog-ng also includes support for the key=value parser and Elasticsearch 1.X, but mapping support in Kibana needs at least Elasticsearch 2.X, so you really need to use syslog-ng 3.8 for this project. If you are still unsure whether you want to install syslog-ng 3.8, there are a few more interesting features making the upgrade worthwhile, including disk-based buffering.
Configuration
Here are the steps to complete to create your heat map:
1. Before configuring syslog-ng, you should prepare Elasticsearch for handling geo-location data properly. It is called mapping. Be careful because once you use a property, you cannot change its type. The related configuration is copied here from the syslog-ng documentation:
{
   "mappings" : {
      "_default_" : {
         "properties" : {
            "geoip" : {
               "properties" : {
                  "country_code" : {
                     "index" : "not_analyzed",
                     "type" : "string",
                     "doc_values" : true
                  },
                  "latitude" : {
                     "index" : "not_analyzed",
                     "type" : "string",
                     "doc_values" : true
                  },
                  "longitude" : {
                     "type" : "string",
                     "doc_values" : true,
                     "index" : "not_analyzed"
                  },
                  "location" : {
                     "type" : "geo_point"
                  }
               }
            }
         }
      }
   }
}
2. Next, we configure syslog-ng. As a first step, we run the logs through the key=value parser. This creates a new value-pair for each key=value of the iptables logs. The name of these start with “kv.”, so the source IP address of the incoming connection is stored under the “kv.SRC” name.
parser p_kv {kv-parser(prefix("kv.")); };
3. The next parser turns the IP addresses stored in “kv.SRC” into geo-location data. It uses the GeoIP parser for that, and if you are interested in longitude / latitude information instead of just a country name, you should download the “GeoLiteCity” database and locate that in your configuration.
parser p_geoip { geoip( "${kv.SRC}", prefix( "geoip." ) database( "/usr/share/GeoIP/GeoLiteCity.dat" ) ); };
4. The following rewrite transforms the location data into a format used by Elasticsearch and makes sure that no empty value is forwarded.
rewrite r_geoip {
  set(
    "${geoip.latitude},${geoip.longitude}",
    value( "geoip.location" ),
    condition(not "${geoip.latitude}" == "")
  );
};
5. Here comes the log path, which connects all of the above building blocks together. In my case, logs are coming from a TCP source. Next, the logs are parsed and rewritten. Finally, they are sent off to Elasticsearch.
log {
  source(s_tcp);
  parser(p_kv);
  parser(p_geoip);
  rewrite(r_geoip);
  destination(d_elastic);
};
6. Once you are done configuring syslog-ng, reload it, so the configuration takes effect.
7. You can now go back to Elasticsearch and Kibana and start creating dashboards. If you are not yet familiar with Kibana, I recommend doing a short tutorial before starting to analyze your logs.
By default, the world map shows “scaled circle markers” under the Options menu. Change it to “heat map”. You should also change the “minimum opacity” setting to a higher value, otherwise some of the interesting locations are barely visible on the map.
Are you stuck?
If you have questions or comments related to syslog-ng, do not hesitate to contact us. You can reach us by email or you can even chat with us. For a long list of possibilities, check our contact page at https://www.syslog-ng.com/contact-sales/. On Twitter I am available as @PCzanik.


